Monitor and troubleshoot a dedicated server
Armada is deprecated, replaced by AccelByte Multiplayer Servers (AMS), our next-generation dedicated server orchestration product. AGS Premium customers can ask your AccelByte account team about enabling AMS for your environments.
Armada is not available on AGS Starter tier, use AMS instead.
Overview
When your game is in development, issues will arise when using your dedicated server. This section is about debugging your game server as quickly as possible.
Additionally, when your game goes live, you will want to see the live status of all running dedicated servers in each of your regions. And, you will want to monitor the health of all your dedicated servers, whether live or currently inactive.
This guide outlines the tools that are available to you, for debugging and monitoring.
Goals
After you complete this guide, you should be able to:
- Utilize the admin portal to see the overall server status.
- Utilize the admin portal to see the regional server status.
- Locate and examine a live dedicated server.
- Access the live log of a dedicated server, for troubleshooting and debugging.
- Locate and examine a historical dedicated server.
- Locate and understand the dedicated server allocation events and the server status.
- Download the dedicated server log and artifact files, from a historical server entry.
Prerequisites
Before you begin this guide, you should have:
- Integrated a dedicated server with the AccelByte server SDK.
- Created a dedicated server that is able to register with Armada, after it finishes loading game assets.
- Access to the Admin Portal and the Namespace for your game.
- Uploaded a dedicated server to Armada.
- Finished configuring your Armada environment.
- Created a deployment.
Tour the Monitoring Dashboard
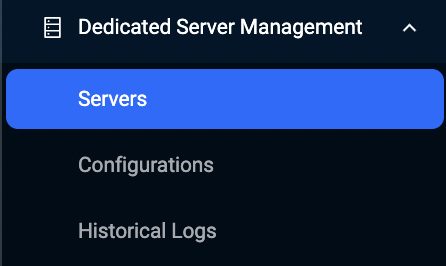
To open the monitoring dashboard, locate the Dedicated Server Management section in the side bar, then click the Server button.
The monitoring dashboard can be located in the subsequent page:
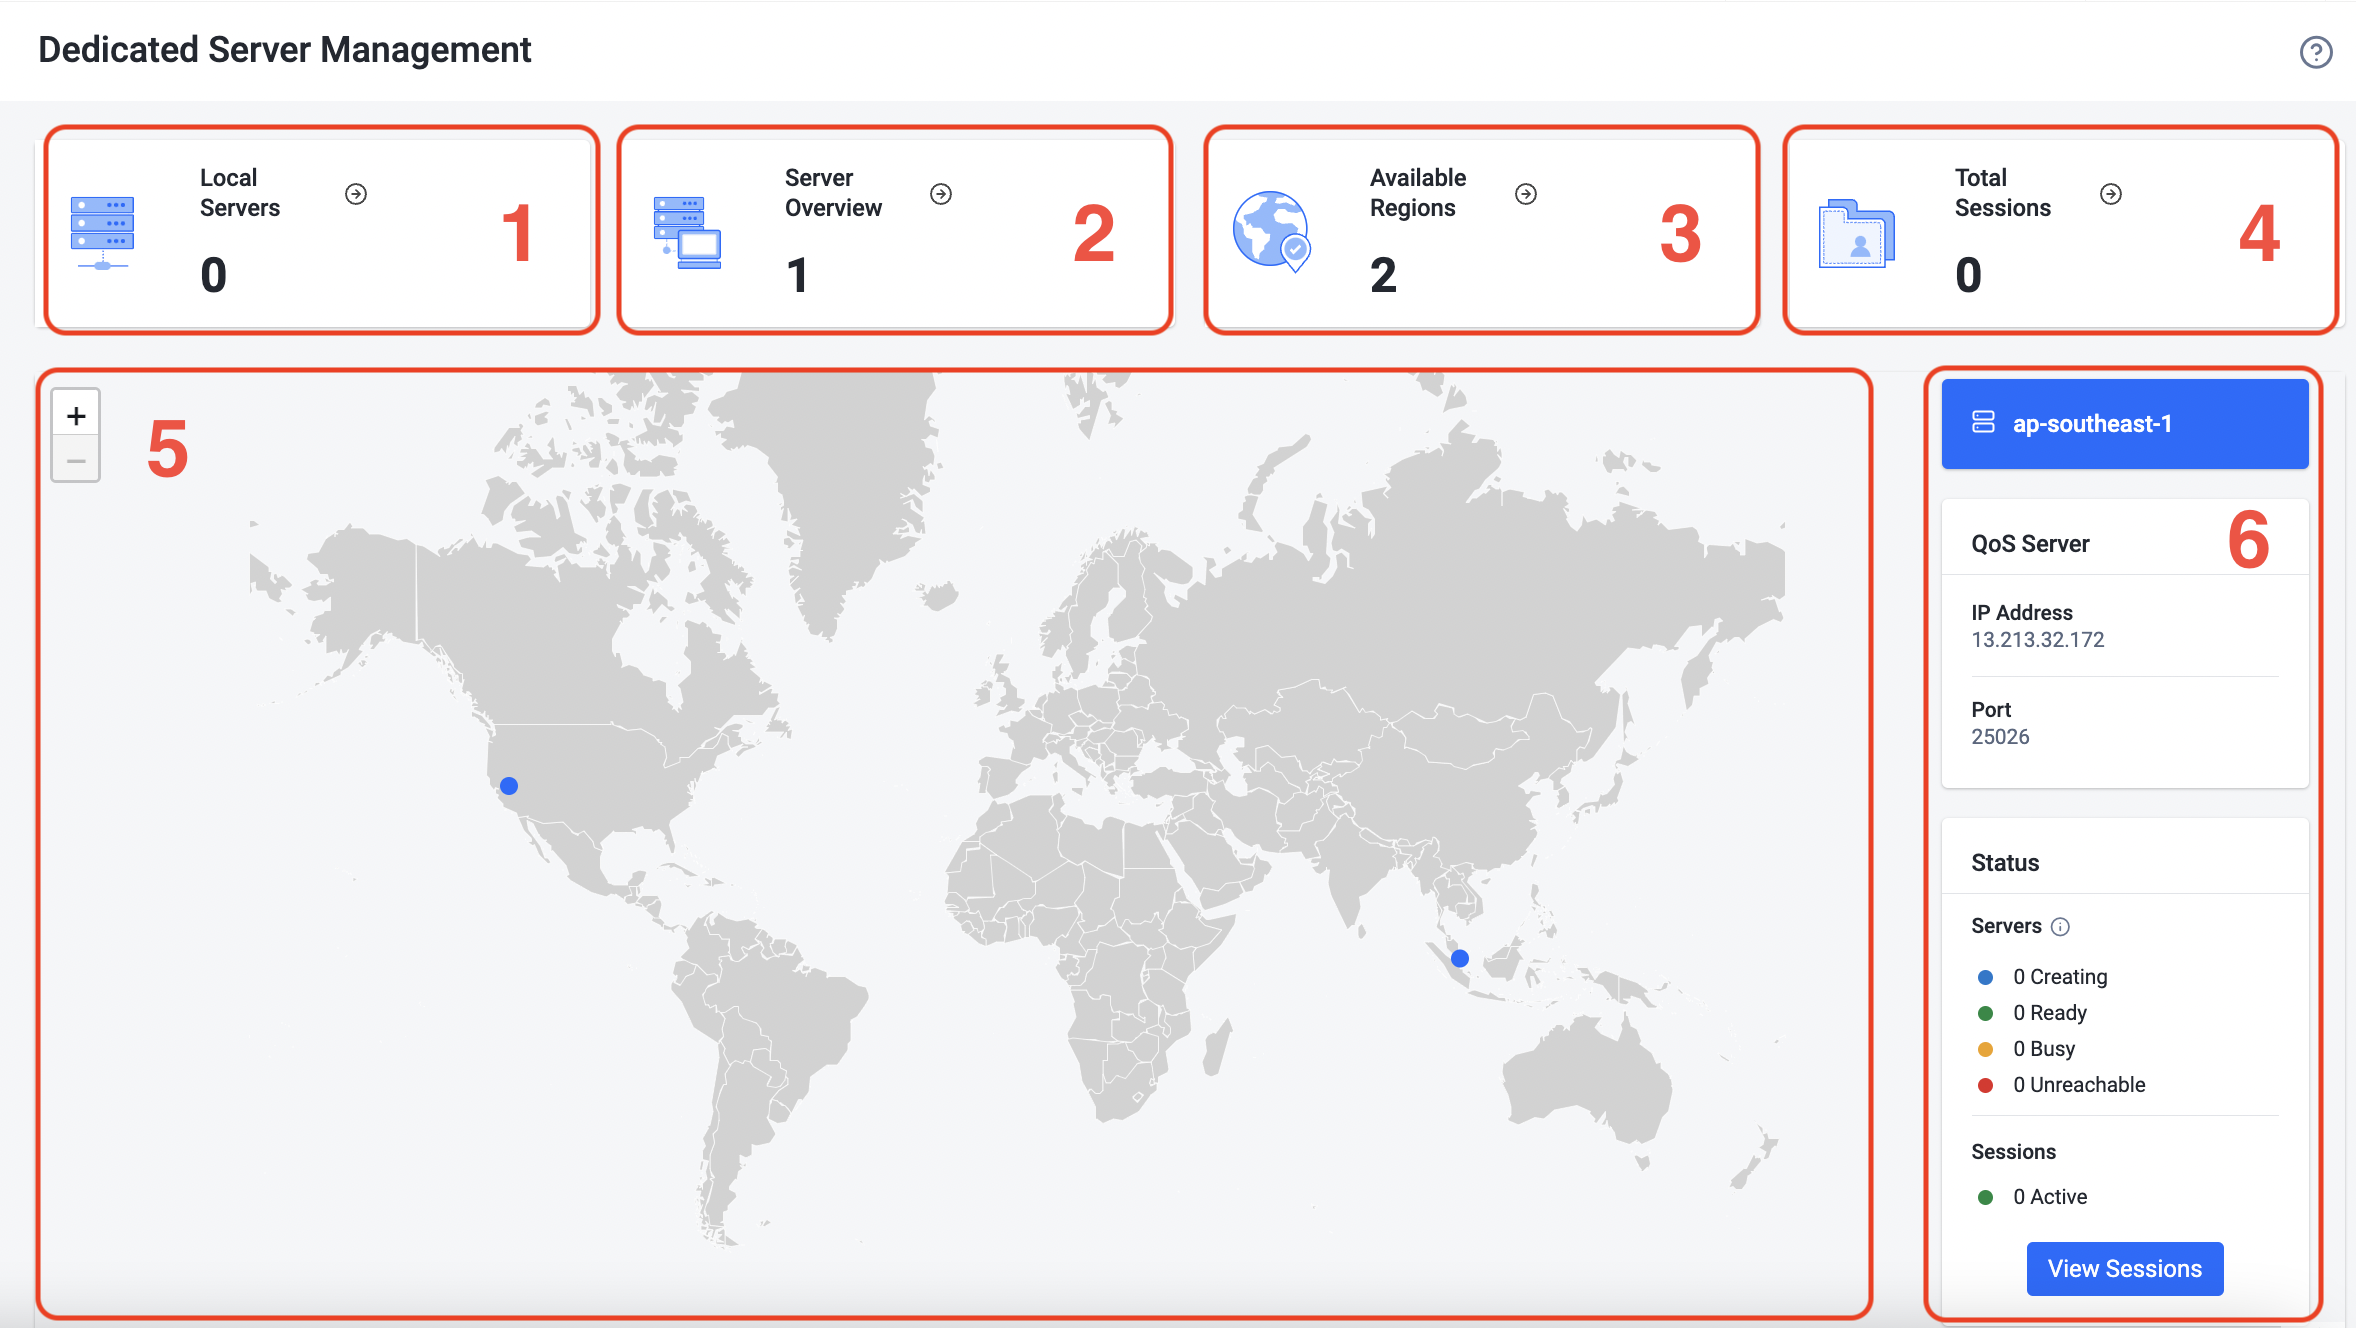
The status shown in this dashboard is a combination of all the active deployments that the namespace requires.
1: Local Servers
This section of the dashboard shows the number of locally connected dedicated servers. You can see, and manage, a list of local dedicated servers that are connected to Armada, by clicking the arrow button beside the number. Refer to Debugging Dedicated Servers Locally.
2: Server Overview
This section shows the number of dedicated servers that are managed by Armada. You can see, and manage, a list of dedicated servers that are being managed by Armada, by clicking the arrow button beside the number. This is the most used section of the dashboard, described later in Armada Servers Overview.
3: Available Regions
This section shows the number of regions that are registered to Armada. You can see, and manage, a list of regions by clicking the arrow button beside the number.
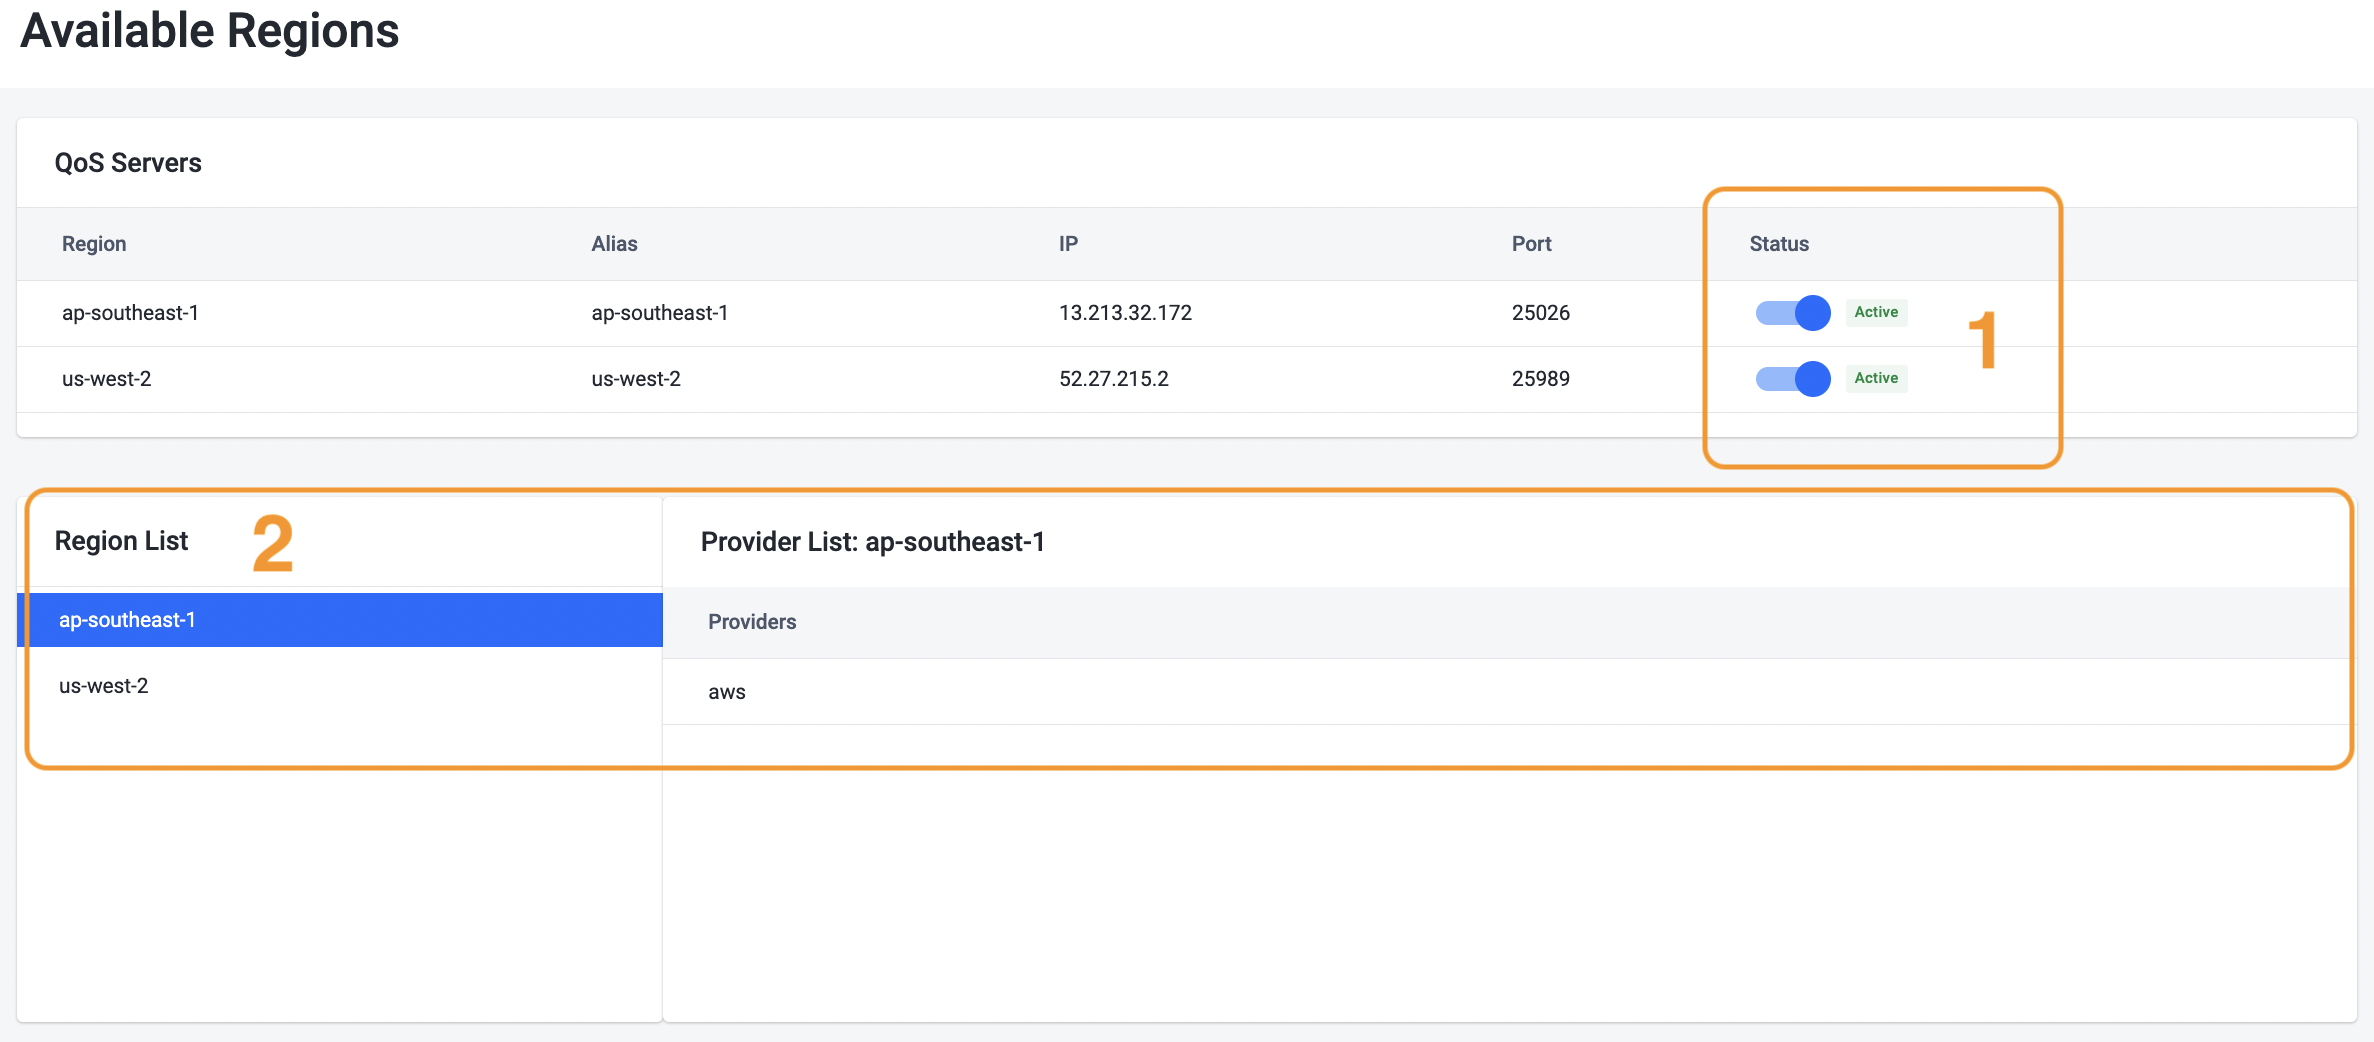
1: QoS Servers Status
In addition to the detailed information on the QoS servers, you can switch the availability of the server by using the toggle button.
Disabling a region will only prevent any additional dedicated servers from spinning up in the region, and remove all "Ready" servers. All running "Busy" dedicated servers will not be affected.
2: Region list
You can peruse the virtual machine providers by region by clicking the region in the list.
4: Total Sessions
This section shows all the active sessions. View and manage sessions by clicking the arrow button beside the number.
5: World map
This section shows all available regions. Click the marker in the region to see the detailed regional status.
6: Regional Information
This section shows the regional status of dedicated servers, from all deployments within the namespace, as well as detailed information about the QoS server located in the region.
Armada Servers Overview
After you have clicked the arrow button in the Server Overiew section of the Monitoring dashboard, you will be directed to the server list page, which will detail every allocated dedicated server.
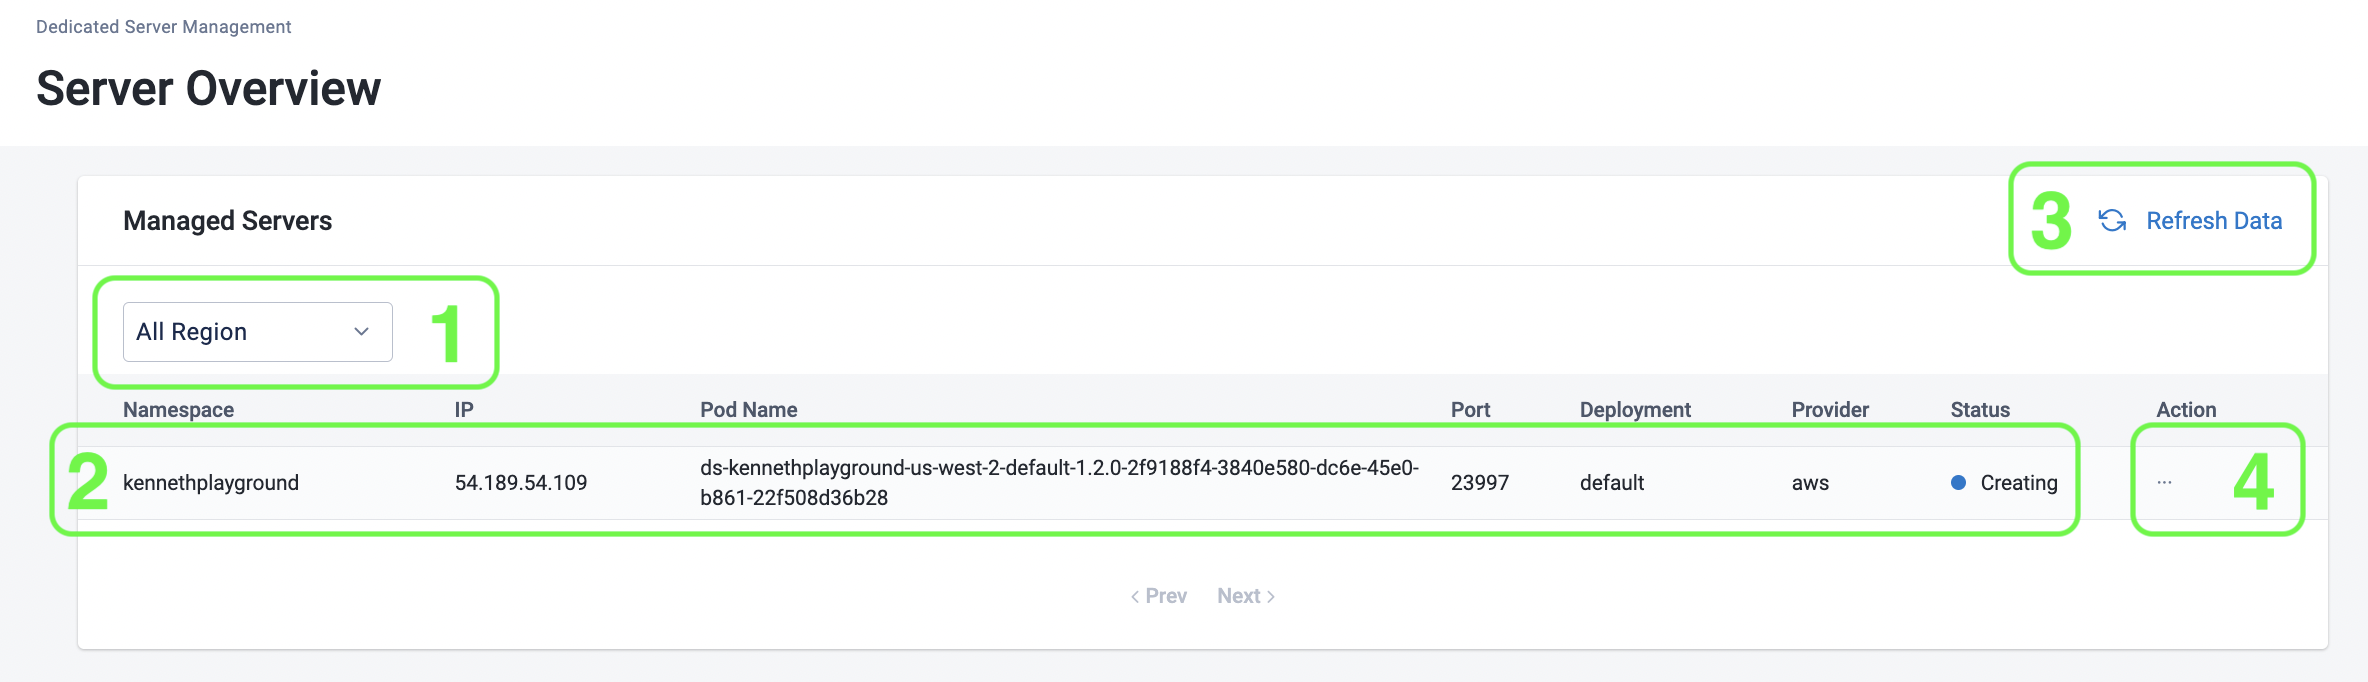
- Region filter: filter your dedicated servers by region by using this dropdown box.
- Dedicated server entry: display the essential information of a dedicated server.
The pod name of a dedicated server is its' unique identifier.
- Refresh button: to refresh data in the page.
- Action button: open up the action menu, available actions are View and Delete.
Temporary Servers
When Armada is experiencing high demand or temporary resource exhaustion, you may see a temporary entry denoted by the suffix "-temp". These temporary entries are placeholders for allocation jobs that are waiting for resources to run them. As such, these temporary entries will not have pod names, nor have server IPs, nor available ports.
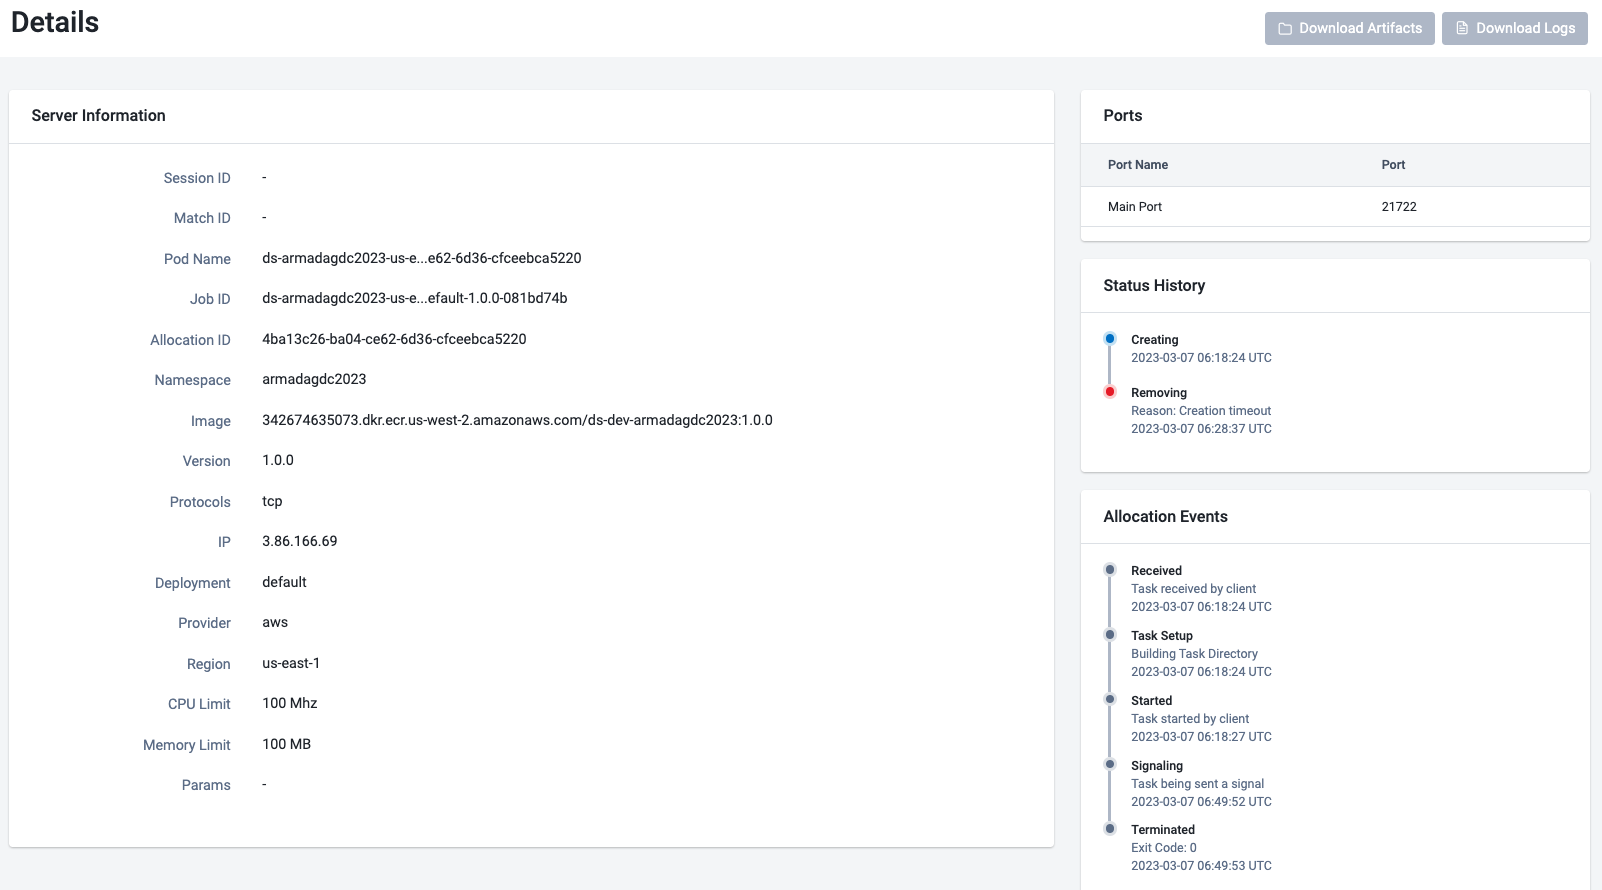
Viewing a Dedicated Server
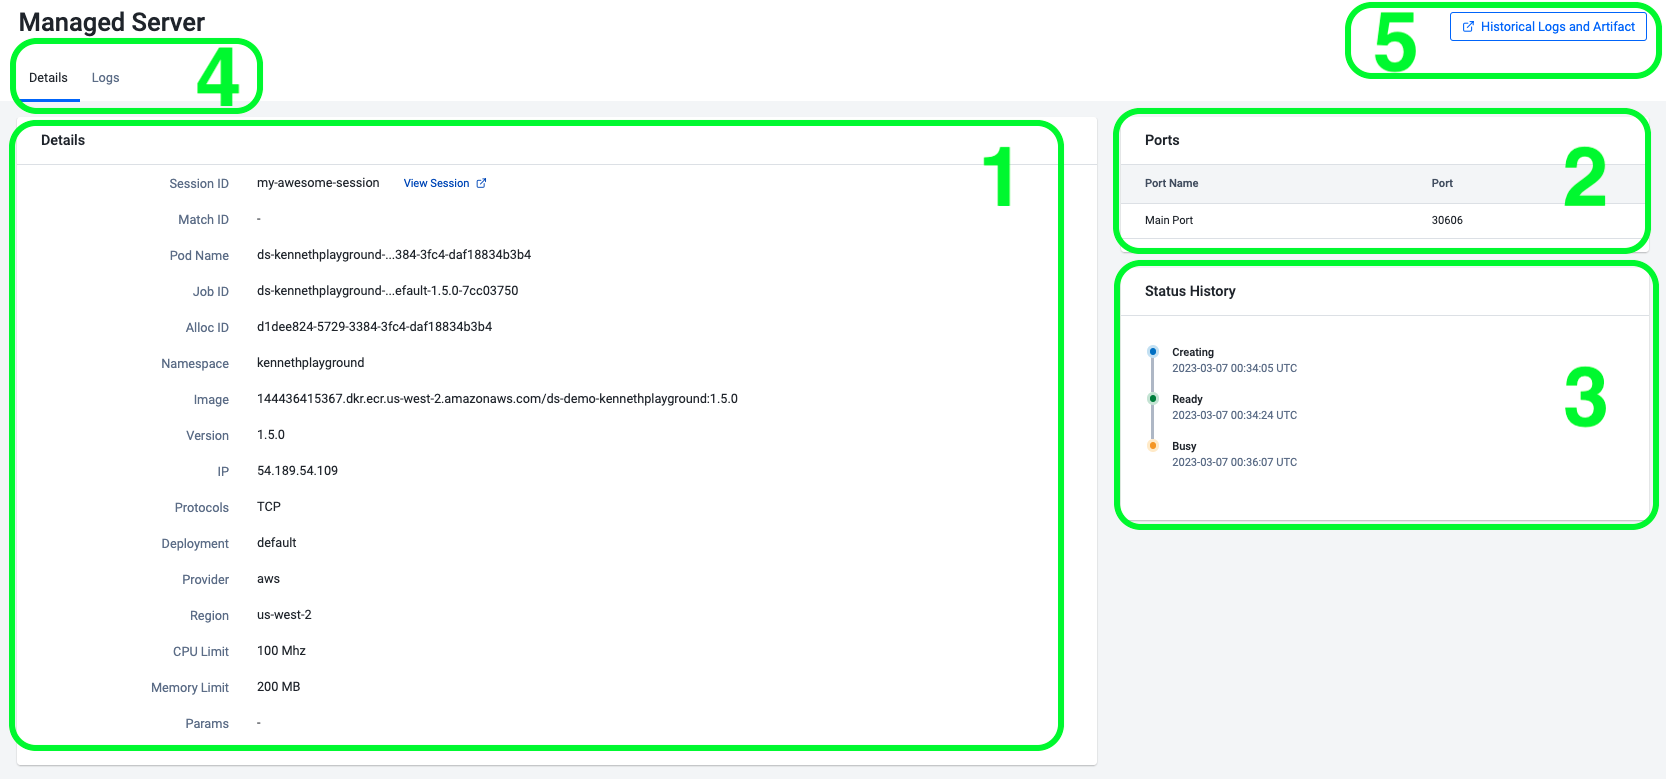
This page contains detailed information on a selected dedicated server. To access this page, use the "View" action on a dedicated server entry.
- Details: contains detailed information of the dedicated server.
- Ports: a list of external ports (ports that the game clients connect to) will be port forwarded to the respective ports that the dedicated servers listen to.
- Status history and Allocation events: a history of dedicated server state changes, and the allocation events from the orchestrators. This information is invaluable to help you troubleshoot your dedicated servers.
- Details and Logs tab: use these tab buttons to access the Details tab and the live logs tab.
- Historical log button: use this button to redirect to the historical log of the server session, where you could download dedicated server logs and artifact files.
In order to troubleshoot your dedicated servers, it is important to understand the various meanings of the server status and allocation events.
Dedicated Server Status
Armada keeps track of the dedicated server status, for details refer to The Lifecycle of a Dedicated Server.
| Status | Description |
|---|---|
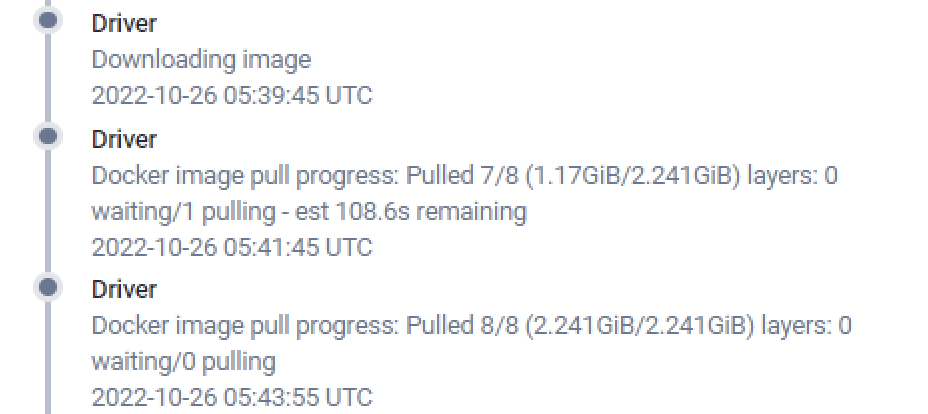
| Creating | When the server is preparing its resource to handle game session workload, it will be changed to “Ready” once the server confirms its readiness to Armada by calling the RegisterServerToDSM API. If this status is immediately followed by the Removing status, your dedicated server may have crashed. You can look further into allocation events to see any non zero exit code under the terminated event. Alternatively, if this status is followed by nothing else in the historical log, the server may have been shut down by the creation timeout. You can then look further into the allocation events to see if your server is in the Killing state before it was in the Started state. Another common cause is when the server is still downloading when it hit the creation timeout, in this case you should be able to see in the Driver state that the Docker image pull progress never reached 8/8 - see the image below. |
| Ready | The server is locked and loaded to serve game session workload, and will be changed to “Busy” once a server is claimed by the matchmaker, or a custom service. |
| Busy | The server is serving a game session workload. |
| Unreachable | The server has lost connection to Armada, causing Armada to remove the server. |
| Removing | The server is being removed by Armada. Additionally, you are able to see why the server is removed, whether it has exited peacefully, terminated forcefully, or removed by one of the timeouts. |
Allocation events
Allocations events are produced when the orchestrator perform actions to physically allocate a dedicated server on a virtual machine.
| Event | Description |
|---|---|
Received | Fired when Armada receives the request to spin up a new dedicated server. |
Task Setup | Fired when Armada is allocating resources for the new dedicated server. |
Driver | Fired when the dedicated server container is initializing, you can also see the download status of your dedicated server if it is the first time the server is run on a virtual machine. |
Started | Fired when the container initialization is completed and starts executing the server binary. |
Signaling | Fired when the dedicated server receives a signal from Armada, usually it is a termination signal. |
Terminated | Fired when the dedicated server is terminated, you can also see the exit code of your dedicated server to spot if there were errors. |
Killing | Fired when the container is killed, and the occupying resource is returned to Armada. |
Live Logs
Live logs make live troubleshooting much easier, by enabling developers to view how the dedicated servers reacted to player actions. To access live logs, click the "logs" tab.
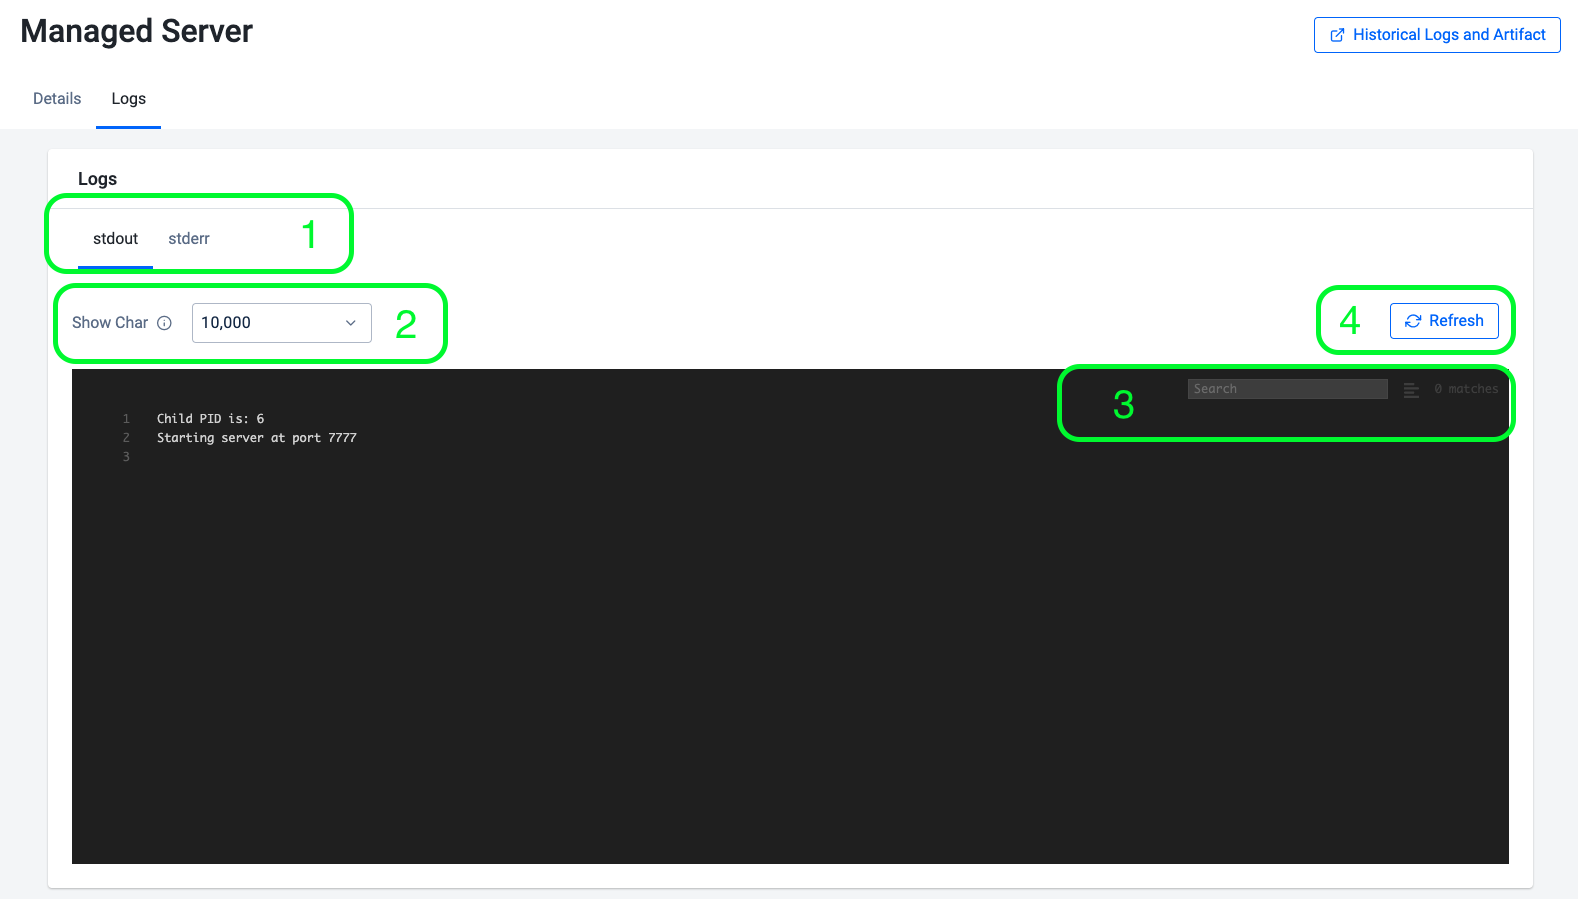
- Logs from stdout and stderr are kept separately.
- The number of characters that are retrieved from each refresh. The more characters to be retrieved, the slower the response.
- A simple search feature provided for you to locate your logs easily.
- A Refresh button to refresh the log display.
Historical Logs
Sometimes, you spot problems in your dedicated servers after they have occurred, and the dedicated server shutdown. Armada will keep dedicated server details and logs for up to 30 day, so that you have time to troubleshoot any problems.
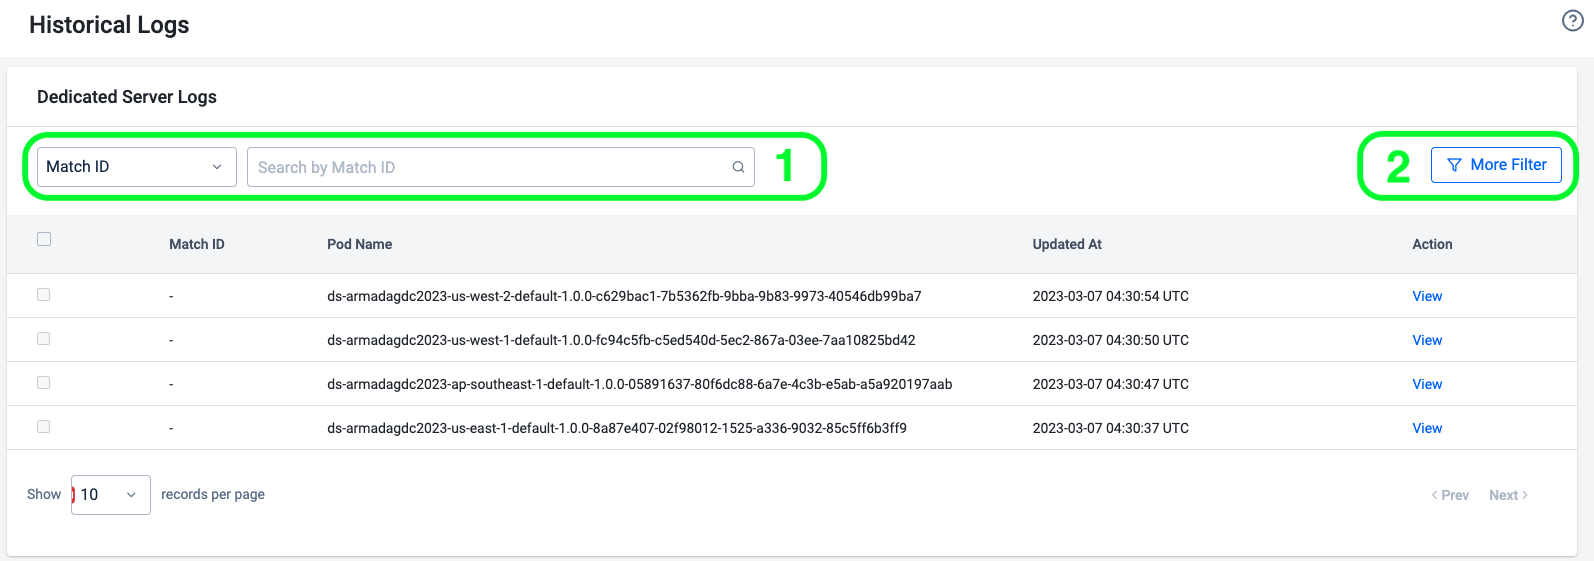
- Search bar: if you have one of the match ID, party ID or pod name that is associated to the dedicated server that you want to locate, use this search bar to find that server entry.
- Filter: alternatively, you can choose to apply a filter on your search results by clicking this button. Filter options that are available to you are the deployment name, start date and end date of the servers.
Once you had located the server entry that you need, click the view button on the entry to get access to the details.
A historical server detail page is quite similar to a live server detail page, with the exception that live logs are no longer available. However, you are able to download dedicated server logs and artifact files from long term storage, by clicking the respective buttons on the top right corner of the page.
It takes 15 minutes for the latest dedicated server logs to be updated to the long term storage.
Artifact files are available 15 minutes after the dedicated server was removed.
Troubleshooting
In this section, you can find common errors and issues that may occur when using the service, along with recommendations on how to resolve them.
A server is stuck in Creating for a long time
There are a few things that may cause this problem:
- The virtual machine is downloading the dedicated server image. If the server image is sufficiently large enough, it may take the virtual machine a few minutes to finish downloading. You can keep track with the state of download in the "allocation events".
- The dedicated server may not be able to register itself to Armada. Check in the dedicated server logs to see if the request was properly responded to.
- Your environment may run out of virtual machine resources to run the dedicated server. You can spot this problem when you see a temporary server entry, without a corresponding entry with a pod name.
Logs/artifact files are not available to download
Wait for 15 minutes for the files to be moved to long-term storage. If this problem persists, please contact your AccelByte Technical Producer.