AIS Custom Dashboard in Grafana
Don't have a dedicated analyst? AccelByte provides professional services for creating and managing dashboards for you. Contact your AccelByte technical producer for more information.
Introduction
AccelByte provides you out-of-box analytics dashboard in the AccelByte Gaming Services (AGS) Admin Portal. However, we recognize that you may want to create your own custom dashboards to fully leverage the capabilities of the AccelByte Intelligence Service (AIS).
AccelByte supports custom AIS dashboards in Grafana. Grafana is a web GUI for creating visualizations of your data, it allows you to write SQL to source data from your AIS Data Warehouse to craft visualizations.
This article walks you through how to add AIS as a data source and create custom AIS dashboards in Grafana. This article only covers the basics of connecting and managing AIS dashboard in Grafana. We recommend that you explore and experiment AIS features to determine what will work with your environment and operation needs. For assistance or advice, contact your AccelByte technical producer.
Common use cases
You can create and use a custom AIS dashboard in Grafana for the following use cases:
- Access your player metrics and build your own analytics such as cohorts, bar chart, player journey, and many more.
- Query your game data based on service and custom telemetry, apply dimension filters (coming soon), and group by which splits the series into each group in that dimension (coming soon).
- Save your custom event queries and everything you build in your custom dashboard once you are done.
Prerequisites
To connect Grafana with AIS, you must have the following:
- An existing account in Grafana.
- Your access information to the AIS Data Warehouse provided by your AccelByte technical producer or the AIS team.
If you're already using the Grafana Dashboard provided by the AIS team, you will have custom AIS dashboards available in the General folder. Those dashboards are ready for you to use and modify.
Connect Grafana to AIS
To connect your Grafana account to the AIS service, follow these steps:
- In Grafana, go to the Configuration menu and add a new data source.
- Choose PostgreSQL, and then fill in the connection information form with your access details to the AIS Data Warehouse.
- Click Save. The AIS Data Warehouse will be added as a data source in your Grafana account.
For more information about adding new data source to Grafana, refer to their official documentation.
Create an AIS dashboard
Creating an AIS dashboard involves the following tasks, in this order:
The proceeding sections aim to give you general guidance on how to complete the above tasks in Grafana. We recommend that you refer to Grafana's documentation for more in-depth information and up-to-date steps.
Create a folder
- On the homepage of your Grafana account, open the Dashboards menu. The Browse Dashboard page appears.
- Click the New button and select New Folder. A form appears.
- Type in a name for the new folder, then click the Create button. The new folder is created.
Create an AIS dashboard
- On the homepage of your Grafana account, open the Dashboards menu.
- On the Browse Dashboard page, click the New button and select New Dashboard. You will have a blank dashboard where you can add new panels.
- To save the dashboard, click the Save button on the top right screen.
- Provide a name for the AIS dashboard and select your target folder.
- Click the Save button to finish creating your dashboard.
Create a visualization panel
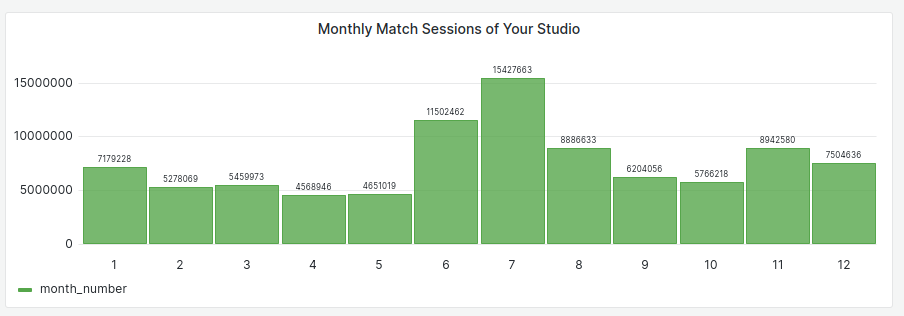
In this example, we will be creating a new visualization panel to show insights on the Monthly Match Session for the games in your studio. The panel will be created on the AIS dashboard.
To create a visualization panel, follow these steps:
Go to your AIS dashboard.
Add a new panel. For this example, use "Monthly Match Sessions of Your Studio" as the title of the panel.
In the Query field, select AIS as your data source.
Click Code to switch to text editor mode.
Copy this SQL code into the Grafana Text Editor.
SELECT
  EXTRACT(MONTH  FROM bsdt.day_ts) AS month_number,
  SUM(bsdt.match_session_count) AS match_session_count
FROM
  bd_session_daily_t AS bsdt
INNER JOIN
  namespace_t AS nt ON nt.id = bsdt.namespace_id
INNER JOIN
  -- (Optional) define it inside WHERE if you want to specify a studio.
  studio_t AS st ON st.id = nt.studio_id
WHERE
  -- Change to FALSE if you don't have production data.
  nt.is_production = TRUE
GROUP BY
  EXTRACT(MONTH  FROM bsdt.day_ts)
ORDER BY
  month_number;
Run the query.
Choose your preferred visualization type. In this example, we will be using Bar Chart. Go to the Bar Chart panel. In the X Axissetting, select
month_number. The data will be visualized and show on the panel.The following image is a sample result of the panel. The graph depicts the total matches of all time, aggregated by month.
Click the Apply button to add the panel to your dashboard.
Save the changes in your dashboard.