Introduction to Extend Observability
Extend is in Open Beta for AGS Premium Clients! This means that the Extend add-on is available for you to try in your development environment. You can submit your feedback via our Extend Open Beta feedback form.
Overview
Grafana Cloud is a robust and comprehensive monitoring and observability platform designed to empower organizations with real-time visualization and analysis of their metrics, logs, and traces. It offers a fully managed and scalable solution, enabling effective monitoring across diverse aspects of infrastructure and applications. With its customizable dashboards, intuitive interface, and extensive plugin ecosystem, Grafana Cloud facilitates seamless data exploration, issue troubleshooting, and informed decision-making. By providing a unified platform for visualizing and comprehending system health and performance, Grafana Cloud proves to be an ideal choice for organizations seeking advanced observability capabilities. For more information about Grafana cloud offerings, please visit https://grafana.com/.
For these reasons, AccelByte has strategically partnered with Grafana Cloud as the preferred back-end solution for its observability requirements. Moreover, Grafana Cloud's support for Label Based Access Control (LBAC) ensures secure access control for metrics and logs, with tracing support to be introduced in 2024. This LBAC functionality enables the AccelByte team to provide telemetry access to clients while maintaining strict segregation at the client level, ensuring data privacy and confidentiality.
Gain access to your Grafana Cloud stack
AccelByte will provide you easy access to your Grafana Cloud stack by authenticating through your AccelByte Gaming Services (AGS) Admin Portal (once you have an environment in AccelByte). Here is a step-by-step on how you can gain access to your Grafana Cloud stack.
Sign in to the AGS Admin Portal.
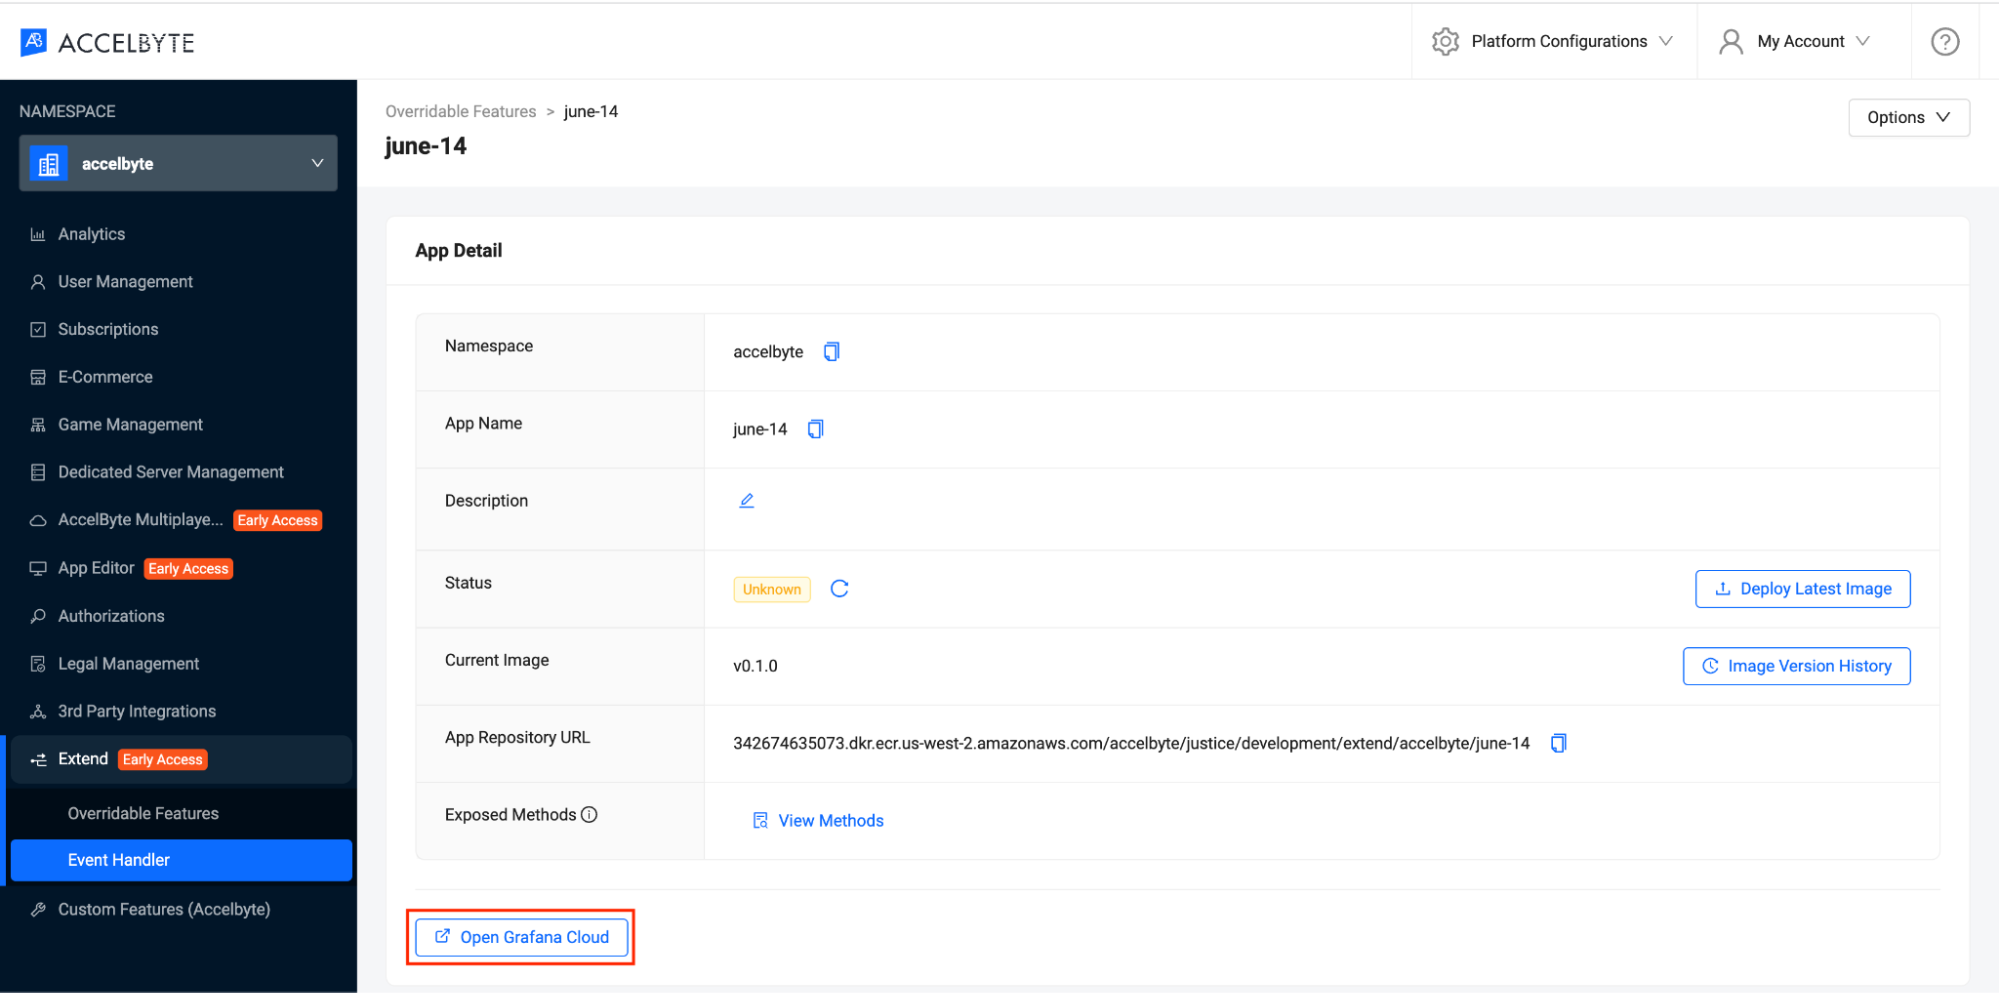
A Grafana Cloud access URL will be provided on the Admin Portal as shown below:
Choose Login with Admin Portal. The link will redirect you to your Admin Portal login page
Log in with your Admin Portal account to access Grafana Cloud setup for your Extend service.
Observability in the context of the Extend App
Our goal is to provide you, as a developer of your Extend app hosted by AccelByte, with comprehensive observability capabilities for your application. This observability encompasses infrastructure health metrics and service health metrics tailored to your specific service deployment. Our commitment is to continually enhance the observability coverage and expand it to include logs and traces in the future. By doing so, we aim to empower you with deeper insights into the performance and behavior of your app, enabling effective monitoring and troubleshooting.
You, as a game developer or studio, will have the ability to query logs and metrics for your Extend app to help troubleshoot issues.
Infrastructure health metrics
We provide the following infrastructure metrics in your Grafana stack:
- App instances count & status
- CPU Utilization
- Limit
- Request
- Memory consumption
- Limit
- Request
- Storage
- Disk Space
- IOPS
- Network
- Bandwidth
- Network usage
Service health metrics
The following service metrics can be accessed in the Grafana stack:
- Request count
- gRPC
- Total request
- Total request per gRPC status code
- Request latency
- Error rates
- HTTP
- Total request
- Total 2xx request
- Total 4xx request
- Total 5xx request
- Request latency
- gRPC
- Incoming kafka events (if applicable)
- Application creation duration
- Deployment creation duration
Metrics and logs query capabilities
As a developer of your Extend app, you have the capability to see your application logs and metrics in Grafana Cloud. We provide this capability by enabling LBAC data sourcing from our central stack to be queried and retrieved from your dedicated stack. To query metrics and logs from your Grafana Cloud stack, you can follow these steps:
Access the Grafana Cloud platform. Start by logging in to your Grafana Cloud account through the Admin Portal as explained in the section above.
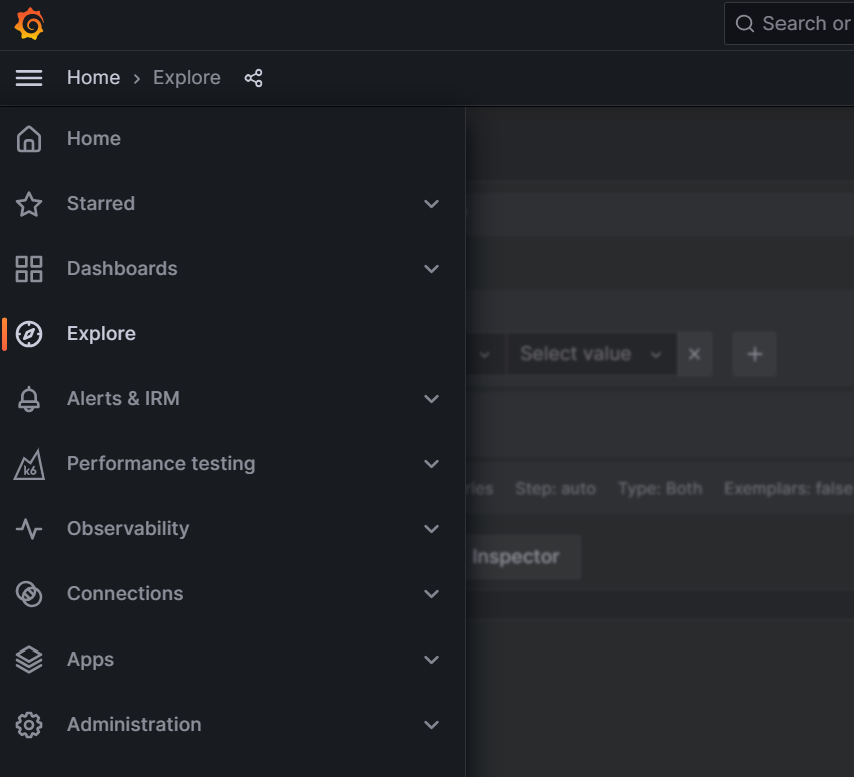
On the sidebar, go to the Explore section.
Grafana Cloud provides you a query editor that allows you to specify the exact metrics or log data you want to retrieve. Data sources for your application usually follow the pattern
log-<your studio name>ormetrics-<your studio name>. You can pick the data source for logs/metrics by accessing the dropdown on the top.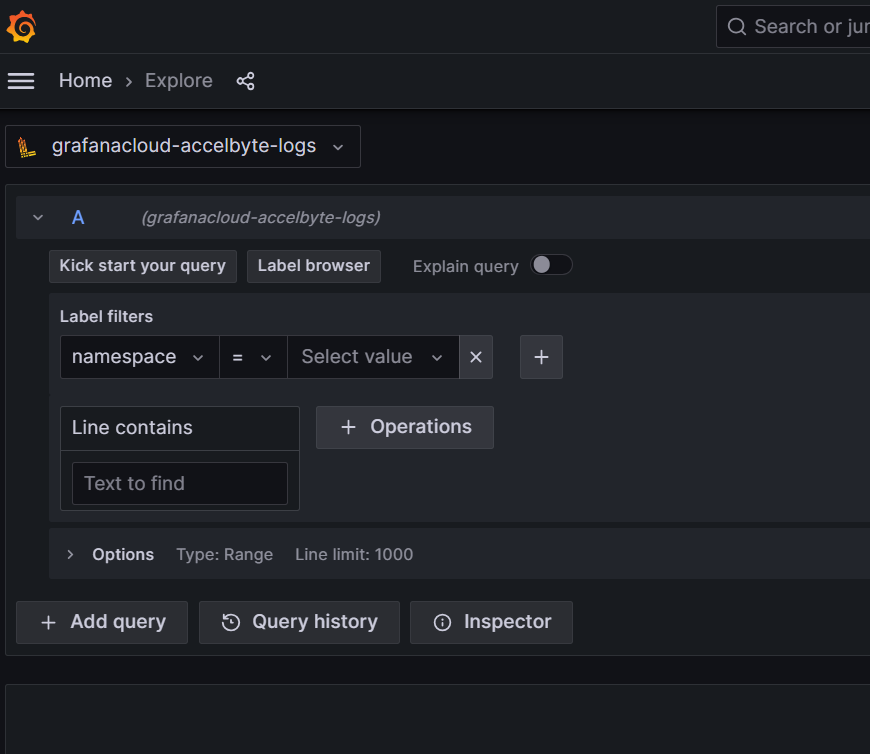
To get your application data, apply the label filters. Choose the namespace label and select
extend-accelbyte-custom-serviceas the value. You can also narrow down the result by utilizing the time filters.Once your queries are defined, you can execute the query using the run query button in the top-right.
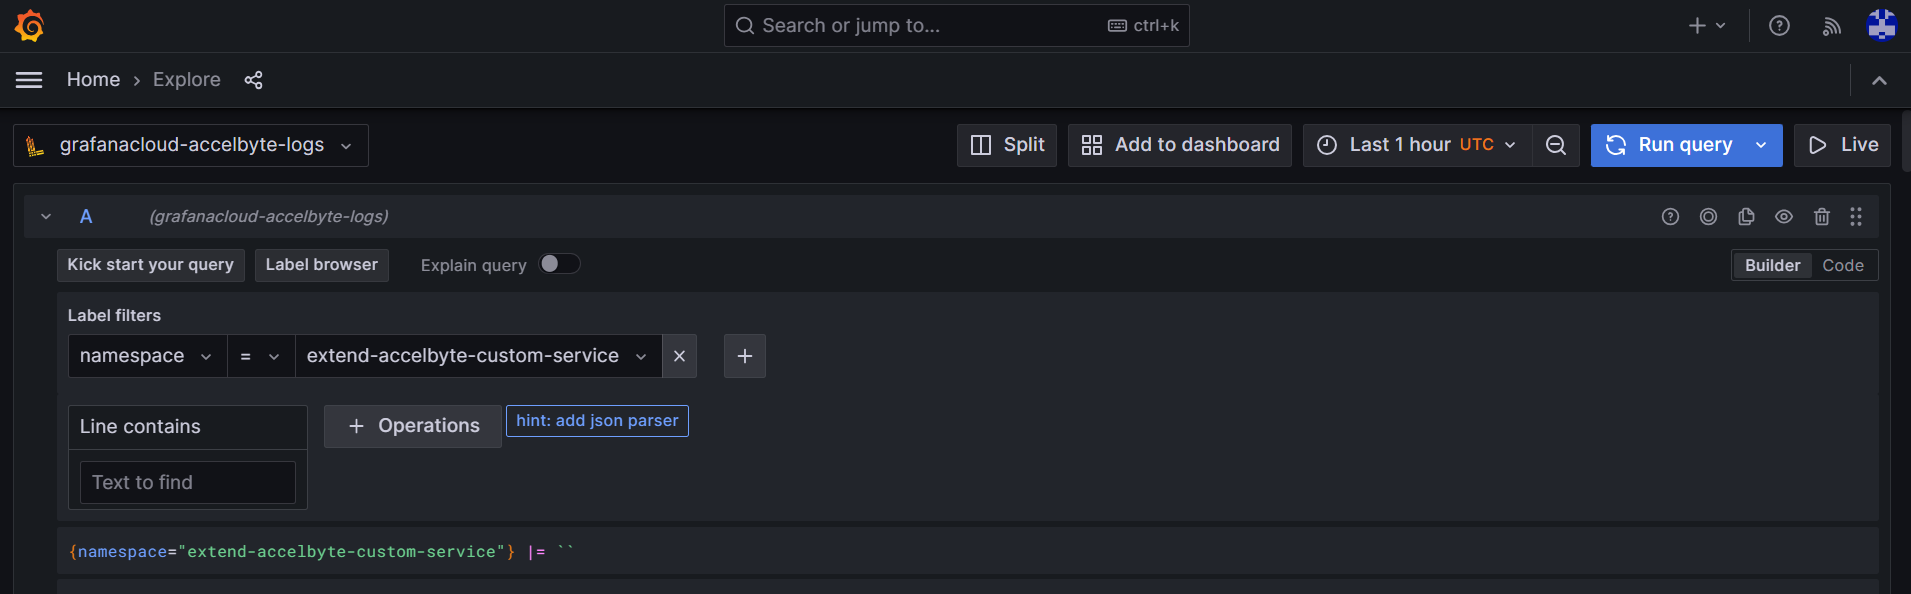
Grafana Cloud will return logs and metrics based on the defined queries in JSON format.
Visualization
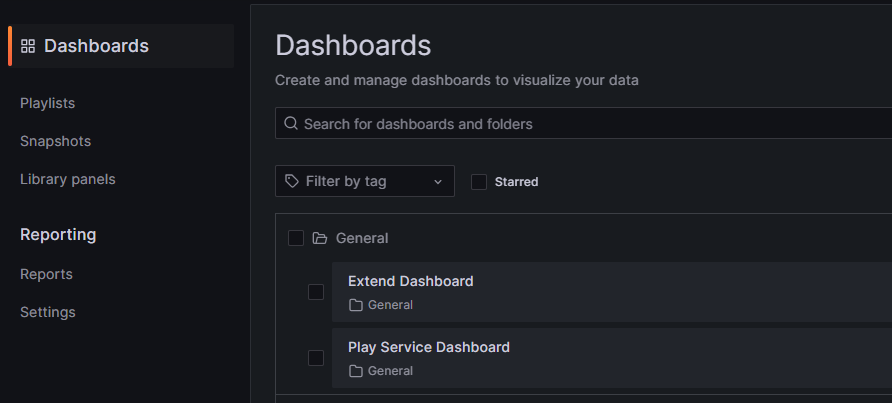
As an Extend app developer, you can visualize the health of an Extend service by utilizing the available dashboards. After your Extend app is provisioned, you can expect the following canned dashboards to be created:
Dashboards
Dashboards will be accessible in the following path: https://<your-grafana-dedicated-stack>.grafana.net/dashboards. As an example, your stack URL might be like this: https://accelbyte12345.grafana.net/dashboards
Custom metrics
You will have the ability to annotate and publish your service-specific metrics to help gain further insights into your app's performance. These metrics will be the metrics that you choose to expose and the metrics that are supplied by the Extend platform. Support and documentation for these metrics will be added soon.